Profiling S2E
This page explains how to profile memory and CPU performance.
Profiling memory usage
We are going to use heaptrack. Its main advantage over competing profilers
is that it is possible to inject it in a running S2E process. Others require using LD_PRELOAD, which interferes
with libs2e.so and causes crashes. The disadvantage is that you cannot inject it before S2E starts.
Build
heaptrackfrom source. Avoid using the one that ships with Ubuntu 18.04, it may not be as reliable.Start S2E
Inject
heaptrackinto the running S2E instance:$ ps aux | grep qemu ubuntu 31044 96.7 4.7 3487216 1191460 pts/8 Sl 13:54 0:03 /home/ubuntu/s2e/env/install/bin/qemu-system-i386 -drive file=/home/ubuntu/s2e/env/images/debian-12.5-i386/image.raw.s2e,format=s2e,cache=writeback -k en-us -nographic -monitor null -m 256M -enable-kvm -serial file:serial.txt -net none -net nic,model=e1000 -loadvm ready $ heaptrack -p 31044 heaptrack output will be written to "/home/ubuntu/heaptrack/build/heaptrack.qemu-system-i38.31044.gz" injecting heaptrack into application via GDB, this might take some time... injection finished ...
Wait for S2E to terminate or kill it manually. You will see the following output:
heaptrack stats:
        allocations:            6836389
        leaked allocations:     46722
        temporary allocations:  1249045
removing heaptrack injection via GDB, this might take some time...
ptrace: No such process.
No symbol table is loaded.  Use the "file" command.
The program is not being run.
Heaptrack finished! Now run the following to investigate the data:

  heaptrack --analyze "/home/ubuntu/heaptrack/build/heaptrack.qemu-system-i38.31044.gz"
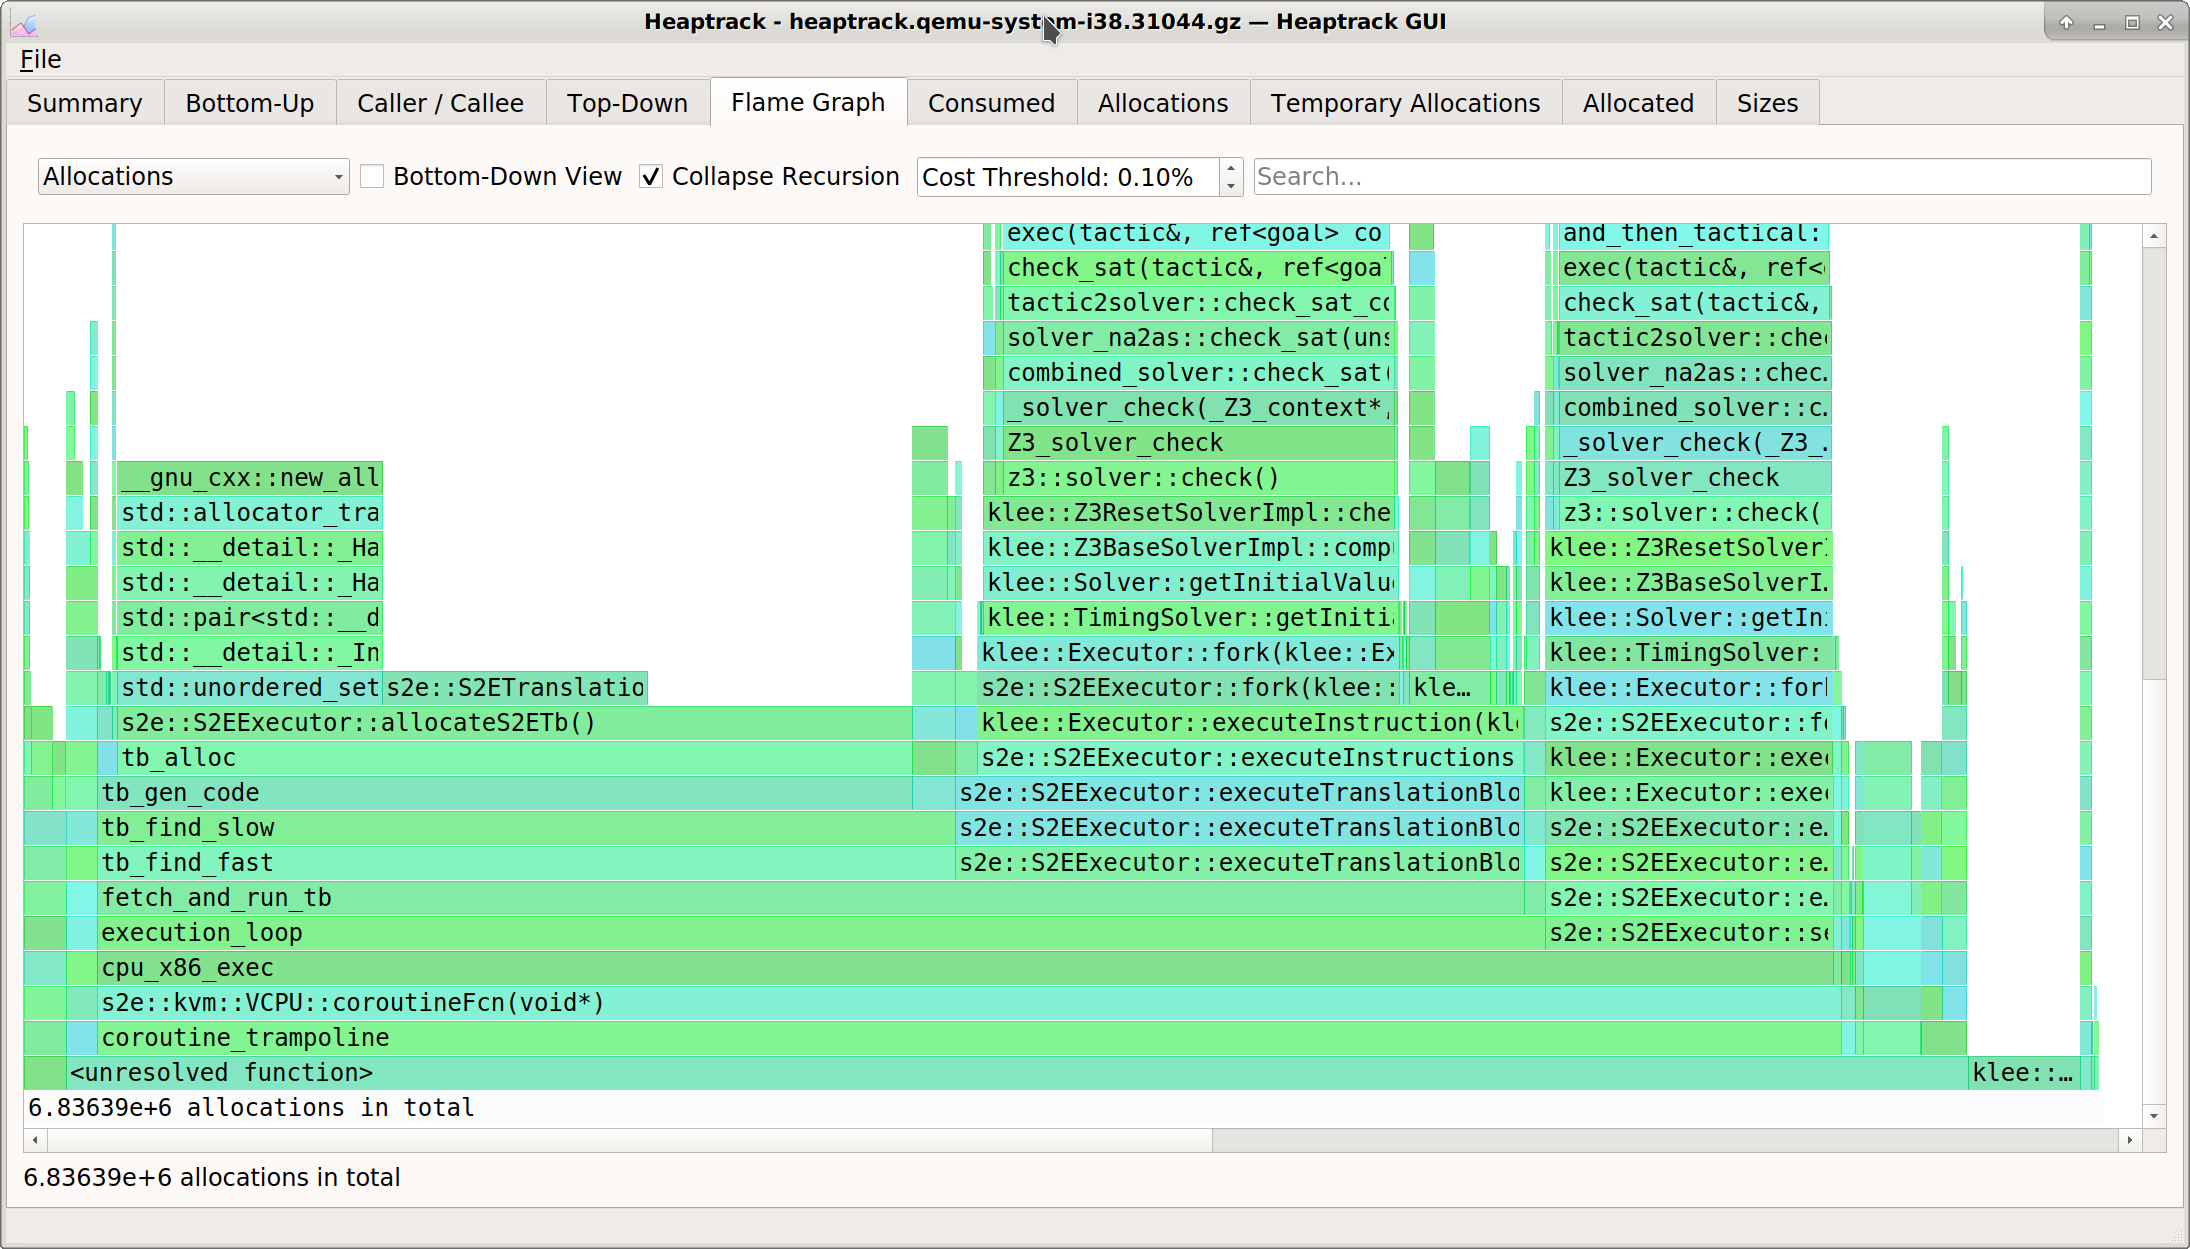
Open the resulting file in the
heaptrackGUI$ heaptrack_gui "/home/ubuntu/heaptrack/build/heaptrack.qemu-system-i38.31044.gz"
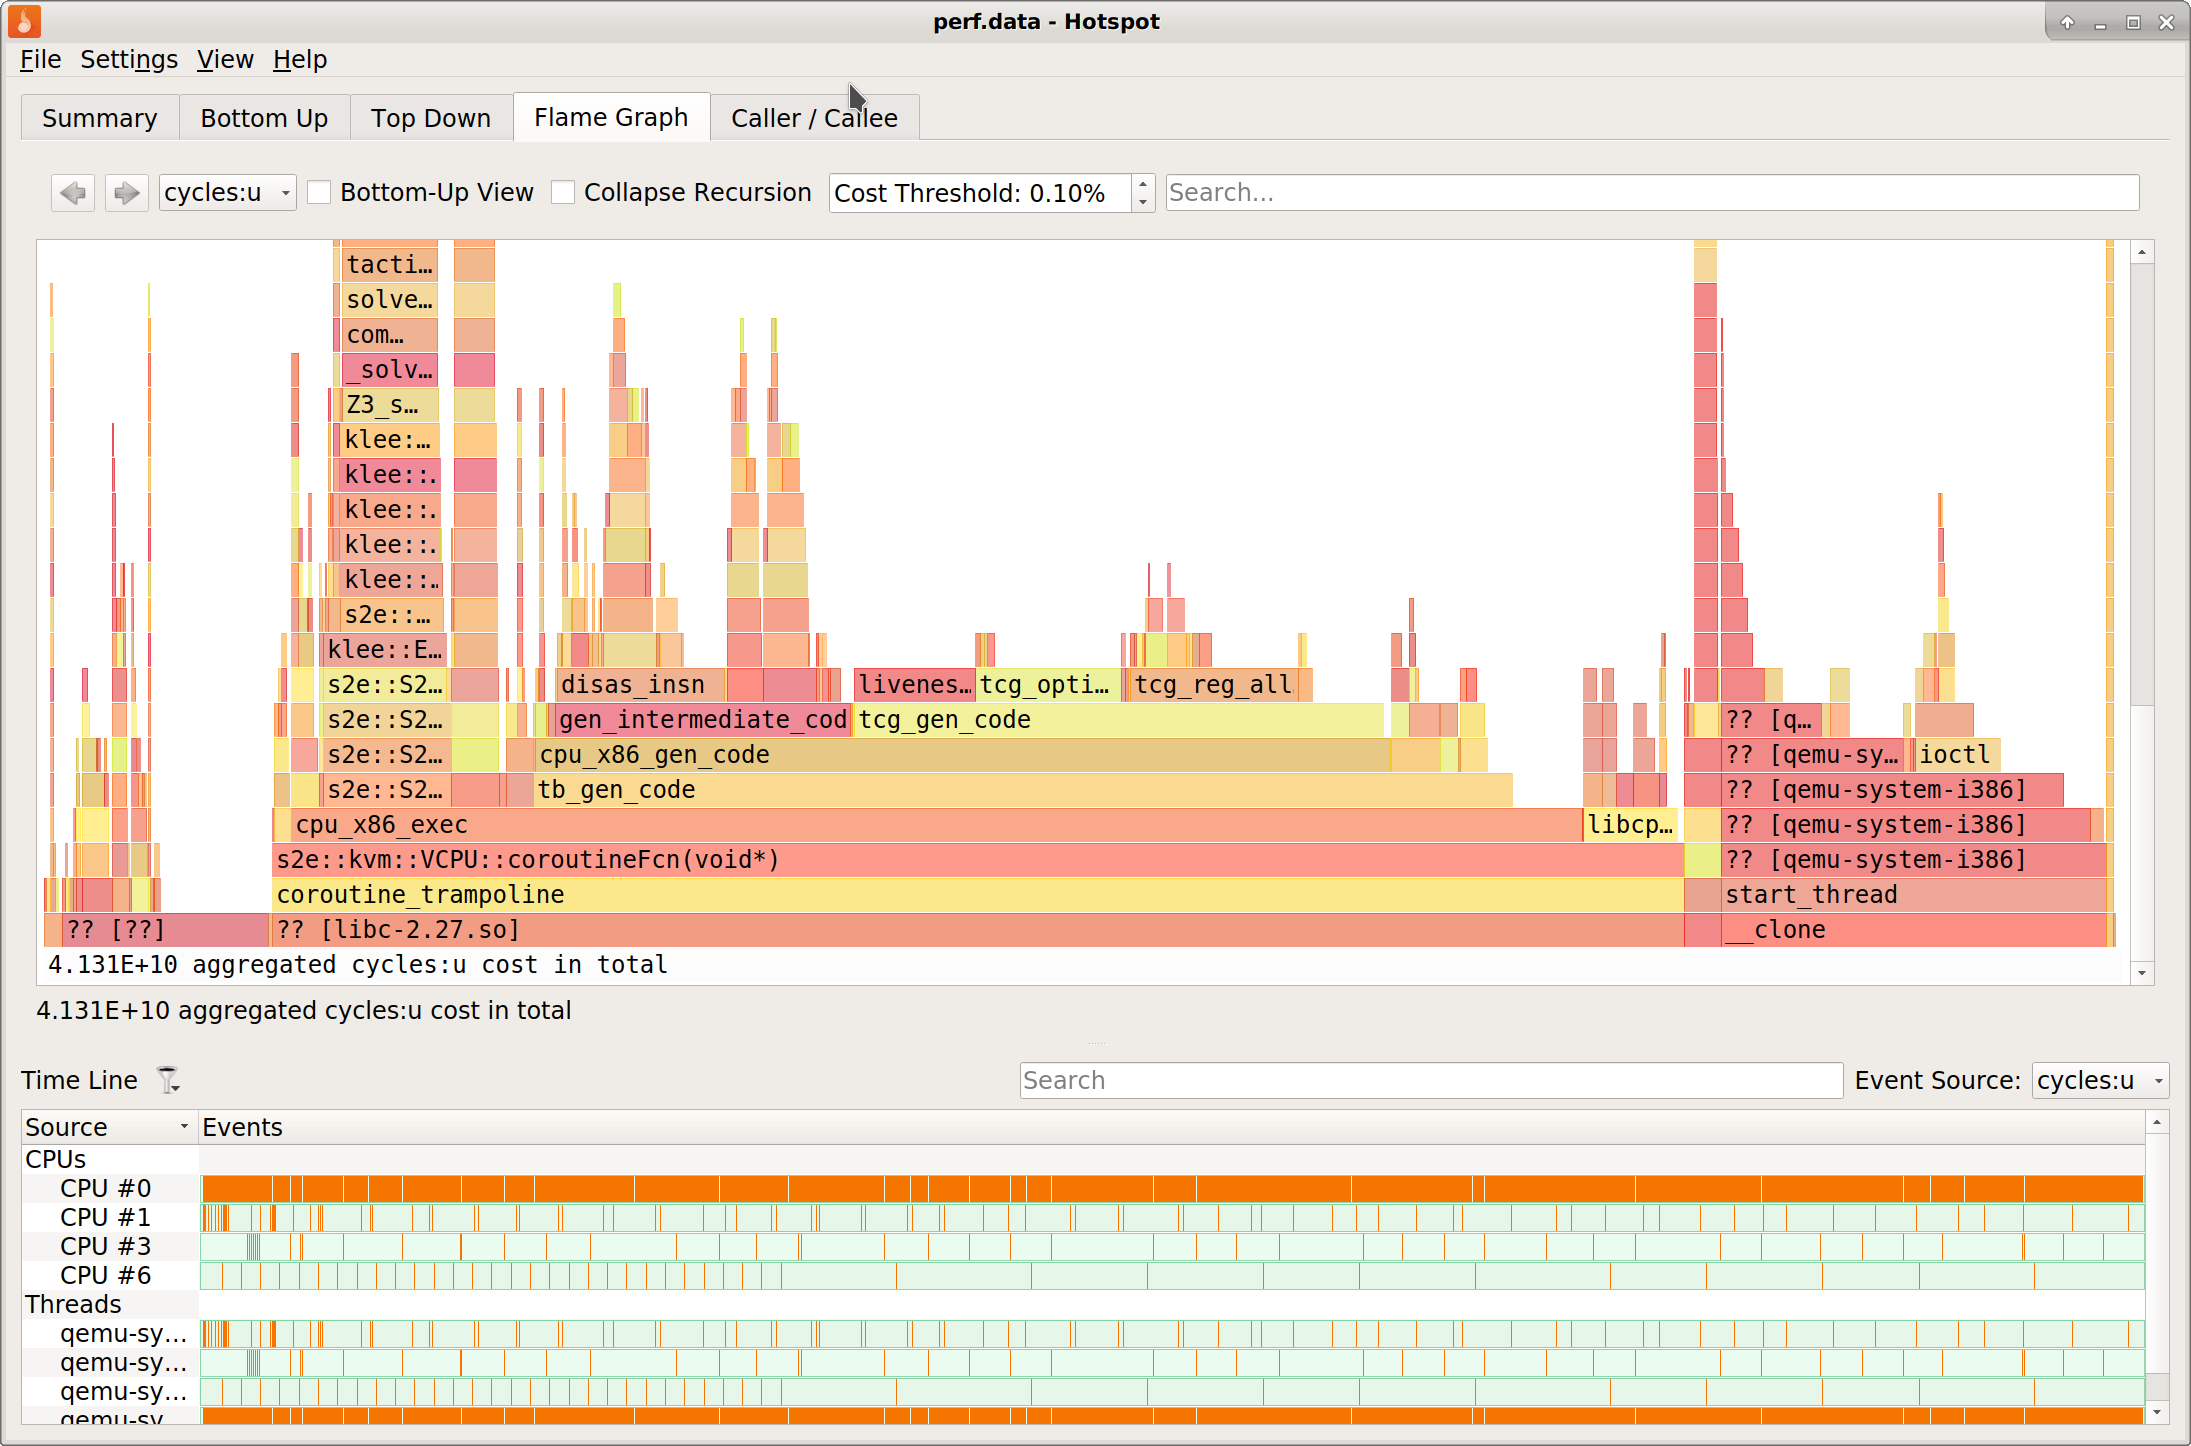
Profiling CPU performance
We are going to use hotspot. It is a convenient GUI wrapper around the Linux perf tool.
Build
hotspotfrom sourceStart
hotspot$ hotspot
Start S2E
Start profiling
Click on
Record DataSelect
Attach To Process(es)Select the S2E instance you want to profile
Click
Start Recording
Stop recording and view results